Sales Enablement Maturity Model
The goal of sales enablement is to optimise your sales process, making your reps more effective and efficient. Companies won’t “fix” their sales with a one-time initiative—it happens through a series of stages, each of which yields tangible benefits. Every company will differ somewhat in the path that they follow, and the state of sales enablement can be uneven—perhaps a good on-boarding programme has been put in place, but content management is in disarray. However, we have found that there is a great deal of similarity in the stages that most companies pass through.
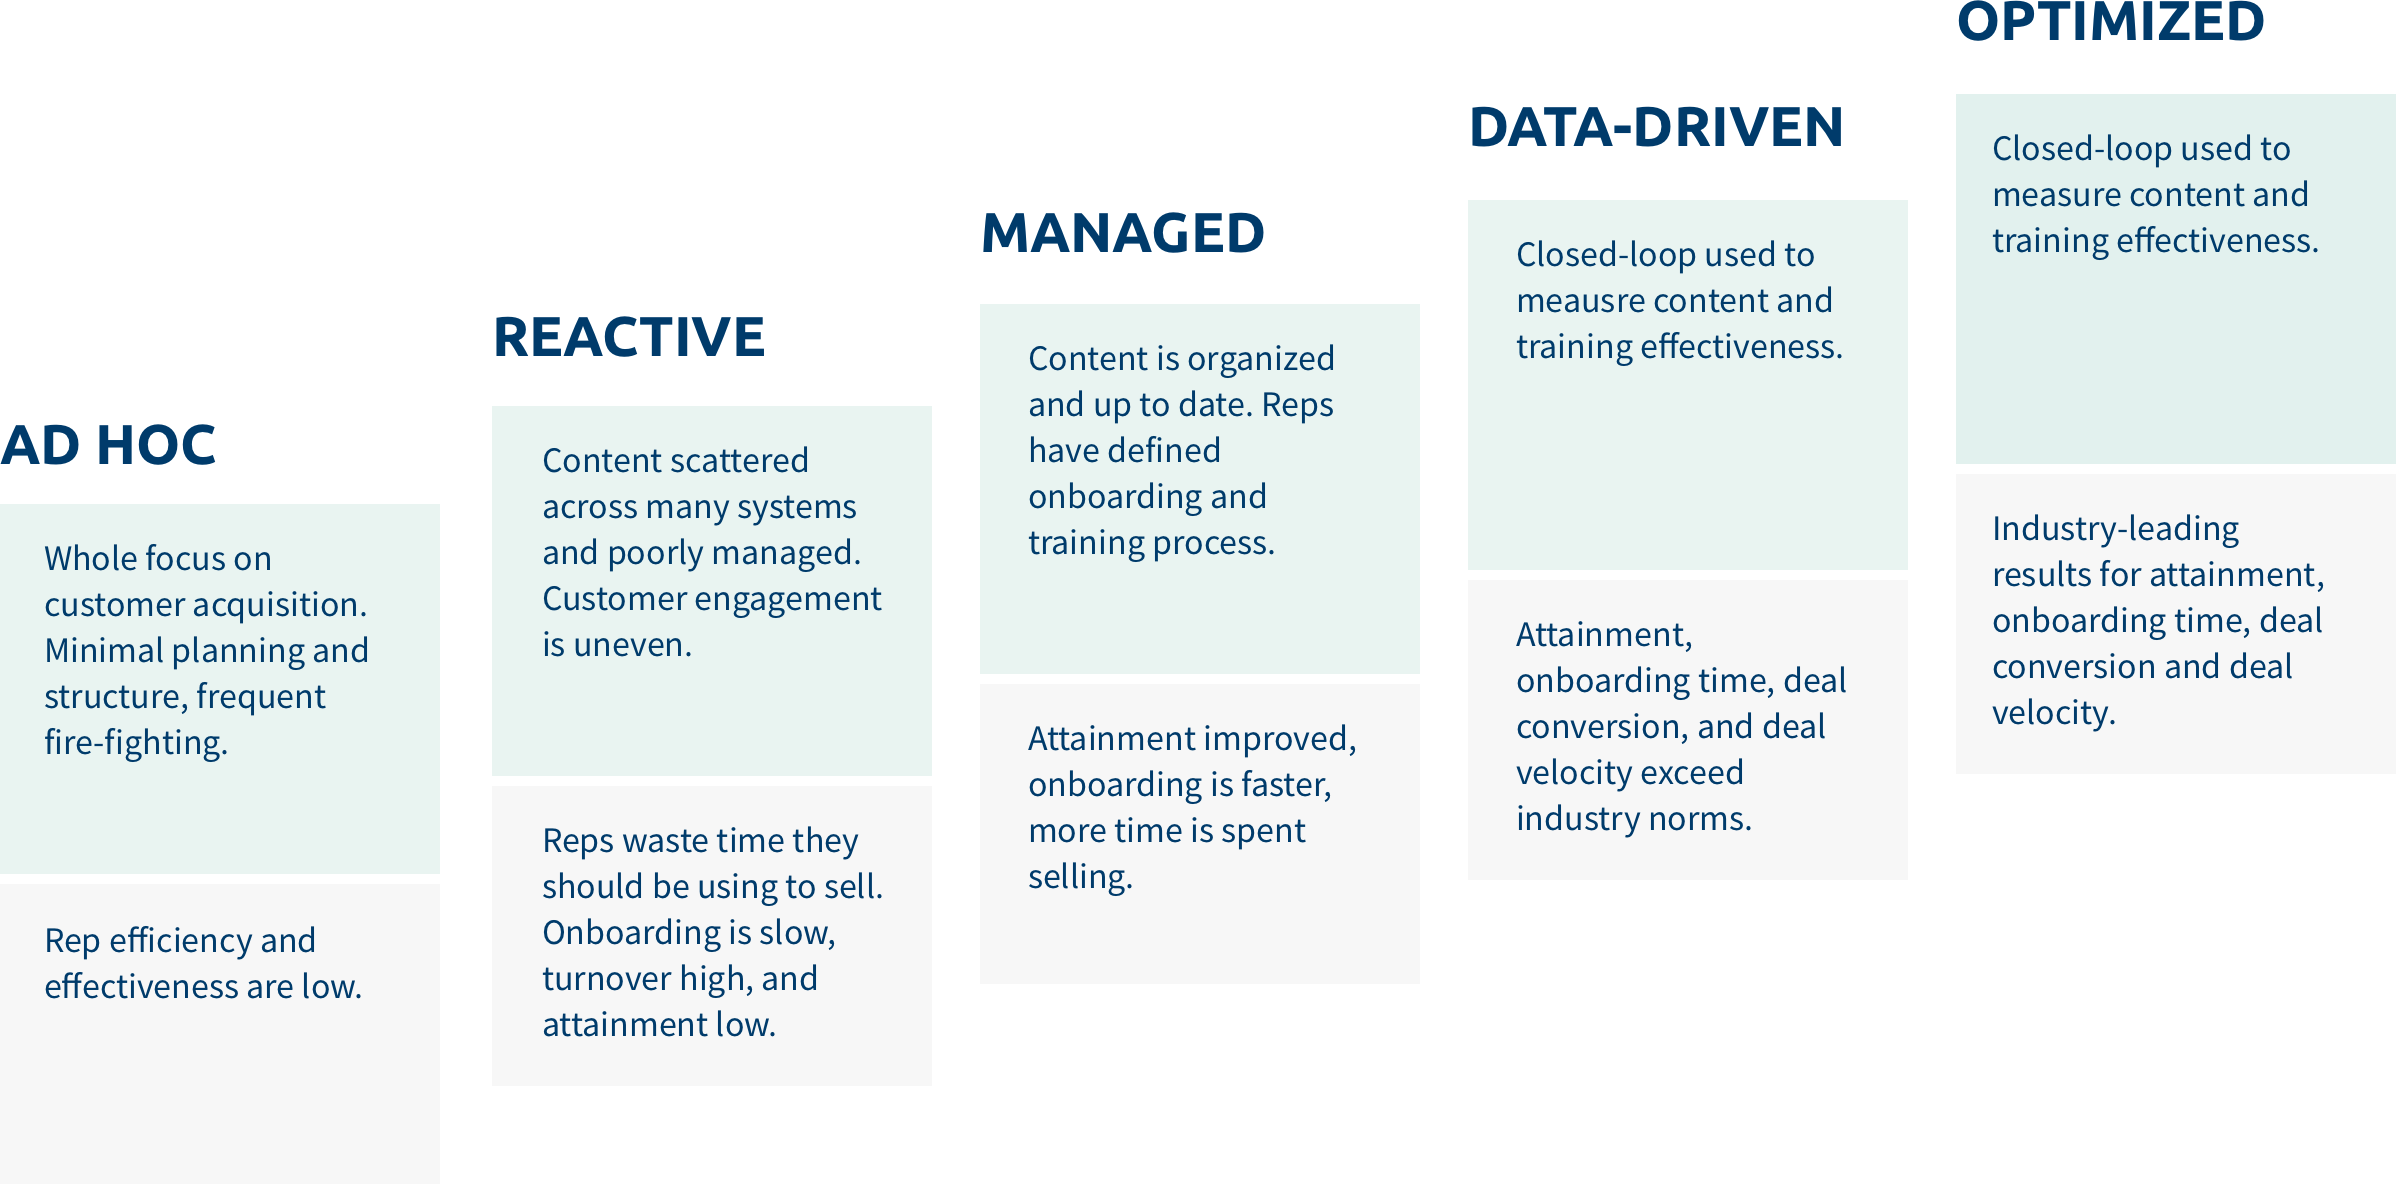
Below, we show the five stages that companies go through as they improve the effectiveness of their sales teams:
Stage 1: Ad-Hoc
This stage is common in young, high-growth companies. The organisation is struggling to provide sales reps with what they need, and only the most important content is available. There isn’t a detailed content plan—marketing is scrambling to produce the most badly needed information as soon as possible. Rep on-boarding is sink or swim.
| Content is typically stored in a shared file system (like Box) or perhaps in a web site built on a technology like SharePoint. It may just be sent around in email. | The focus is on booting up the go-to-market process. Key content is not available, hurting rep effectiveness and forcing them to spend a lot of time creating content to move deals forward. | Nobody is paying attention to anything except “what’s on fire”. There aren’t any content metrics that measure usage or performance yet. |
Stage 2: Reactive
This is the stage where many companies get stuck. The team is working hard to ensure that the right content is available, but poor tool support makes that difficult. There is often a lot of content, though there are important gaps. Content has piled up and is scattered across multiple locations, and much of it is redundant or out of date. Some training is available, but it isn’t well structured or tracked.
| There are multiple content stores, often owned by different teams. These might be a set of files in a system like Box or a site that somebody built in SharePoint. There might be an “official” company sales portal that has been custom built, but nobody likes it so people try to avoid using it much. Reps reach out for help finding what they need through email or perhaps a social networking system like Yammer or Chatter. | Reps often don’t have the right content for engaging with customers, so deals are lost or stalled. Customers are not getting accurate and up to date information, leading to the wrong expectations and future dissatisfaction. Reps waste time looking for what they need and recreating content that already exists. Most “customer- facing” marketing content never reaches a customer. | While the CRM system accurately measures sales, the use of content is still largely invisible. There may be basic usage statistics from some of the content stores – for example, web sites that report how many times a particular item was viewed. |
Stage 3: Managed
At this stage, an effective set of sales enablement tools is in place and the company has the basics covered. There is a well-defined location for content, and it has been mapped to the sales stages of the buyer’s journey so it is organised in a way that reps can understand. There is a content plan and the company is executing against it; older items are regularly updated or pruned. Reps go through a planned on-boarding and training process.
| There is a sales enablement solution in place. It provides a well-known “place of truth” for key content. It has effective search functionality. Content is targeted per opportunity in the CRM system. | Reps have the content they need to engage, leading to higher deal close rates and higher velocity of conversion between sales stages. Reps are more effective at engaging with customers and able to spend more of their time selling. | The system measures solution adoption and health. |
Stage 4: Data-Driven
Analytics are now available for usage and performance of content across the sales cycle, creating a closed loop from marketing to sales to the customer. Content teams are using the information to optimise the content that is being shared with the reps and to optimise their investments. Unused and poorly performing content is removed or improved.
| The business has created reports to measure the core aspects of content performance and seller readiness. Targeted content in the CRM system is scored based on its performance. | Proven content engages customers effectively, yielding higher close rates and faster stage conversion. Marketing investments are focused on content that performs. | Content coverage, freshness, awareness, usage, and engagement are tracked. Seller readiness and training effectiveness is measured against attainment. |
Stage 5: Optimised
Performance is evaluated at every stage of content lifecycle. Best practices from the field are identified and used to improve content quality. Content is recommended based on performance in related deals. Measurement of business impact guides investment and content refinement.
|
|
||
|---|---|---|
| The business captures best practices from the field by identifying how content is being modified and repackaged. There are reports that measure the business impact of content. | Reps use content optimised to be effective for each kind of deal, improving close rates. Marketing investments are ROI driven. | Content comparison shows how content is modified and remixed. Business impact metrics identify influenced revenue, deal conversion and velocity uplift, and ROI. |